
We unravel the key concepts and characteristics of Private Equity (PE) that every investor should be familiar with - from J-curve and value creation strategies to identifying top-performing PE fund managers. Let’s dive in.
Private equity outperforms public markets
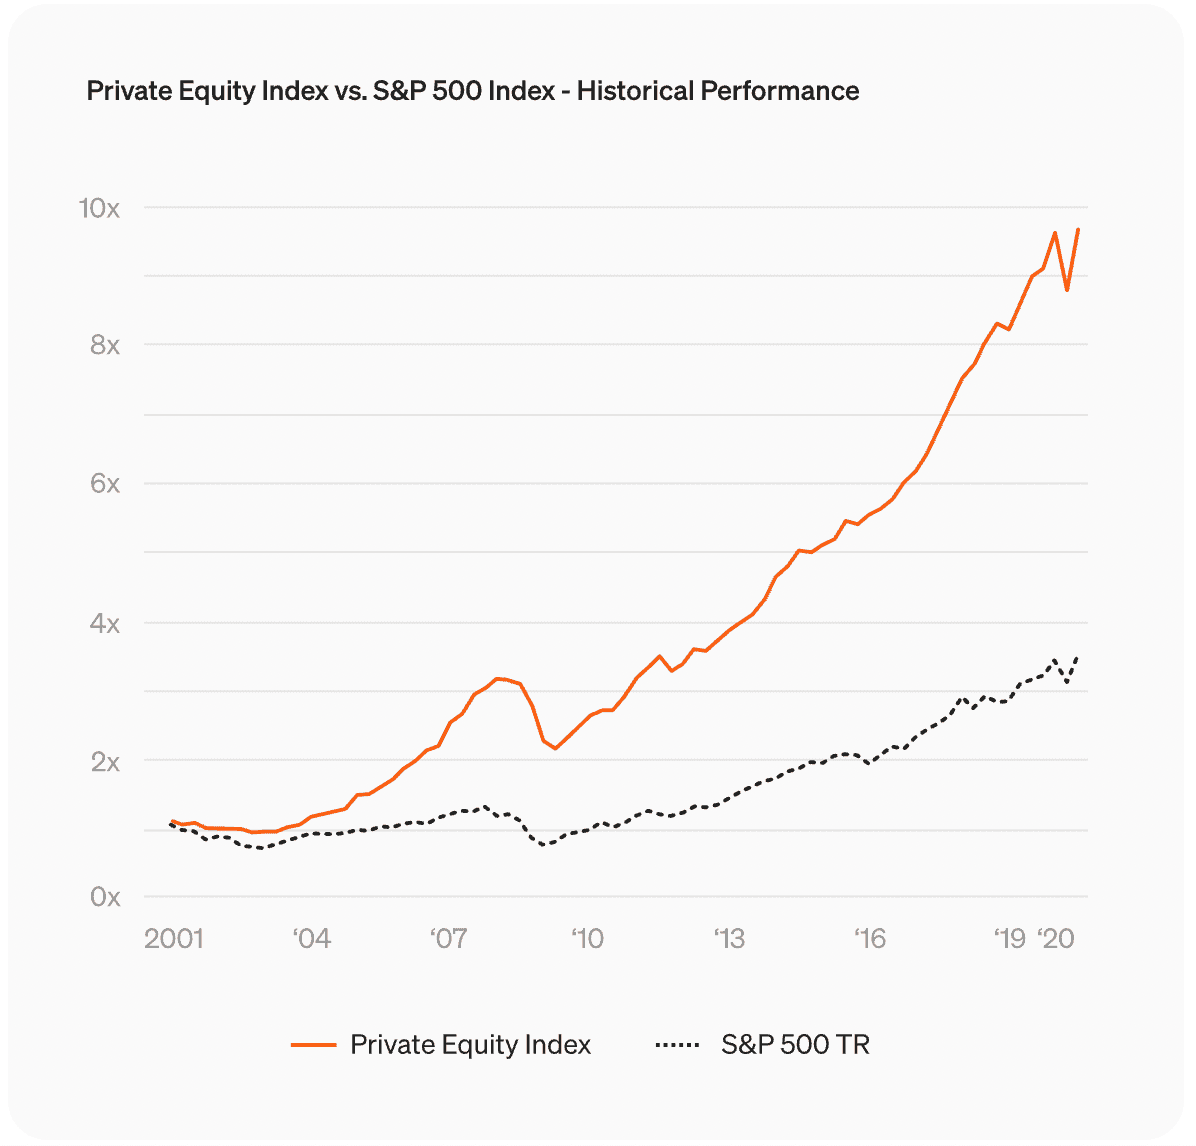
In the last two decades, PE buyout funds generated significantly higher returns compared to the S&P 500 index that tracks the performance of 500 large companies listed on US stock exchanges. While both markets have become much larger in volume, the spread in returns between the two is obvious and will likely continue to widen in the future.
Consider also that individual investors have largely been barred from private market opportunities due to high minimum investment requirements - previously one would need millions of dollars in order to subscribe into a private fund. For this reason, PE was historically a preserve of institutional investors and family offices. Only recently, companies such as Moonfare, started offering access to PE investments to individuals as we’ve been able to lower the threshold of minimum investment, in some cases to as low as $50.000 ¹. (Click to read more on Private vs Public Equity.)
Leveraging different life-cycle opportunities
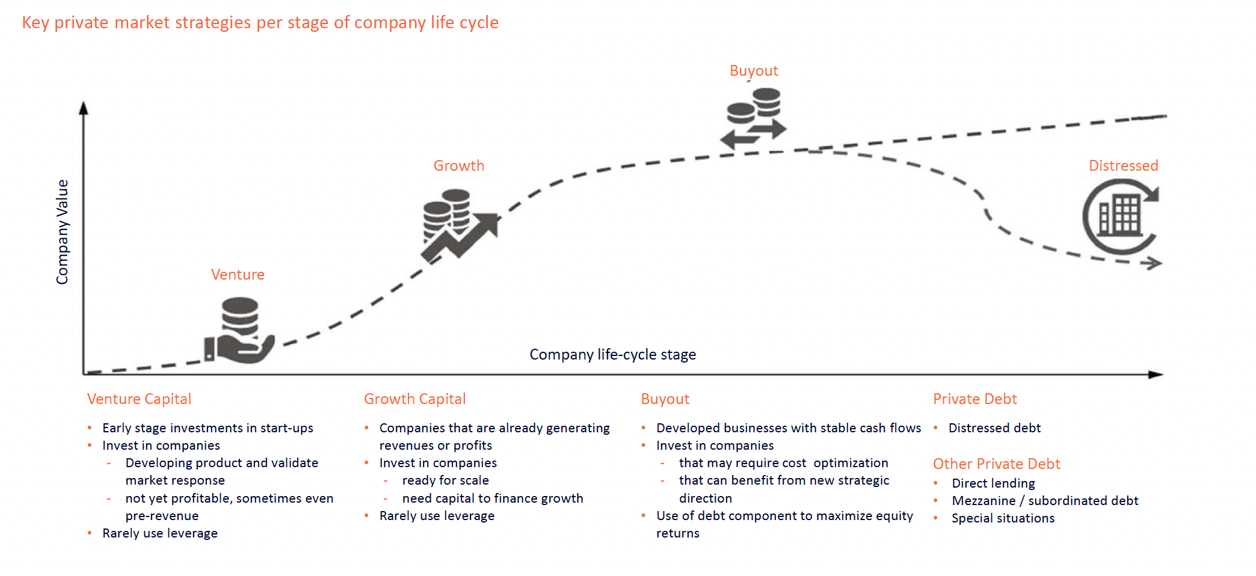
Venture, growth, buyout... These key private market strategies focus on different stages of a company’s lifecycle and their respective distinct risk-return profiles as the company matures. Venture capital funds, for example, invest in startups that are characterized by fast growth rather than profitability. Leverage (use of debt to acquire a stake in the company) is seldom deployed in these types of investments.
The venture phase is followed by the growth or scaling stage. Companies here generate revenues and need capital to finance growth. Some leverage can already be used to finance growth investments. In buyouts, however, leverage becomes a strong value creation lever as PE funds invest in companies that are profitable and have a stable cash flow. The buyout category itself is diverse, consisting of companies of different sizes and cash flow profiles.
At the other end of the lifecycle spectrum are distressed opportunities. These investments fall between private debt and equity. A traditional example includes businesses that are underperforming while fund managers see opportunity for corporate restructuring.
Four main strategies for value creation
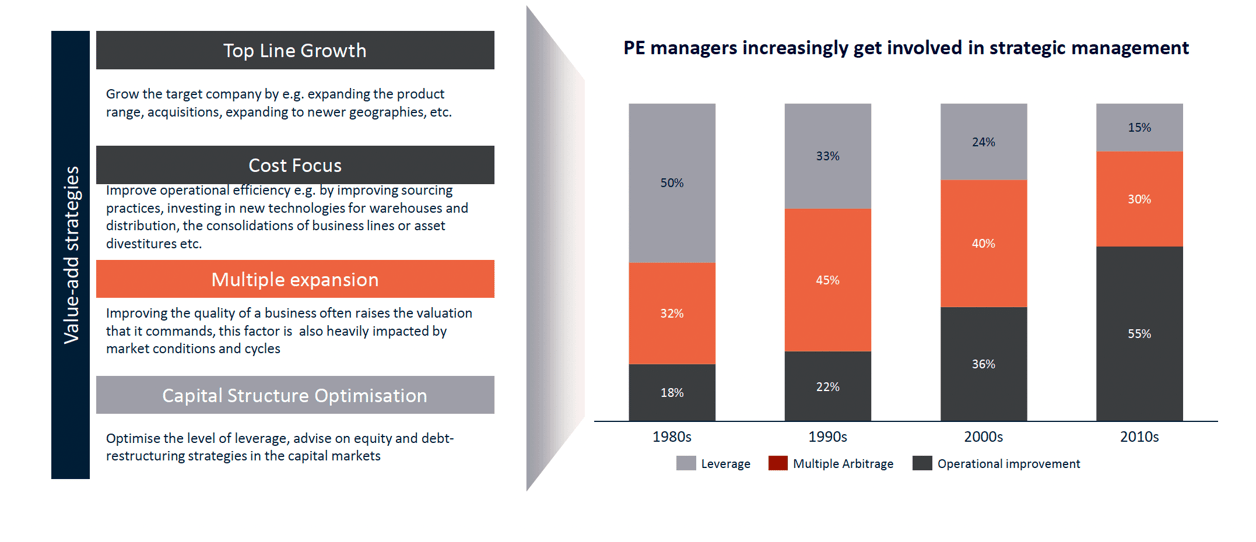
This brings us to our next point - value creation. Regardless of the company stage, PE fund managers use one or a combination of four main strategies to add value. They can, for example, help the company grow the top line by developing new products, acquiring third companies or expanding into new markets. Reducing costs and increasing overall operational effectiveness are also common strategies that PE fund managers deploy to add value.
Multiple arbitrage and capital optimization, on the other hand, depend less on fund managers’ involvement in strategic management. Multiple arbitrage is a practice of increasing the value without operational improvements and capital improvements typically concern debt restructuring or optimization.
The role of debt in private equity changed. In the 1980s, leverage was an important value creation lever - more than 50 percent of returns in PE were generated that way. The role of leverage declined sharply after the global financial crisis of 2007-2008 as many over-leveraged companies defaulted.
Today, fund managers are more conservative in their approach towards leverage. They shifted focus to the operational improvements while relying less on the multiple expansion which largely depends on macro conditions and economic cycles.
Private market strategies have different risk-return profiles
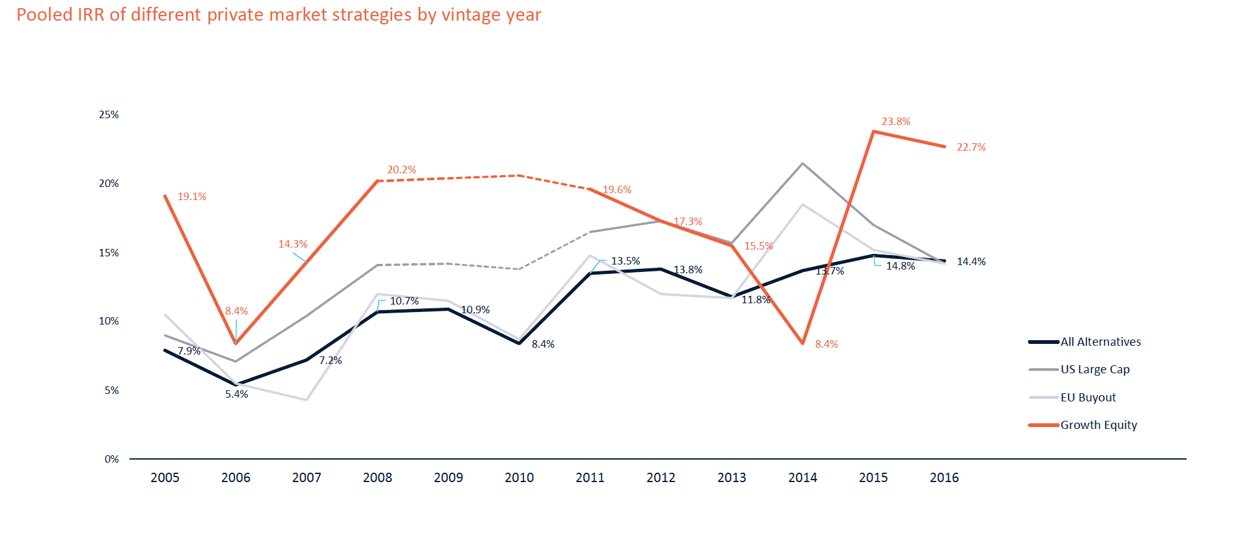
The private market is a world on its own. Many different strategies have emerged since the 1980s when today’s largest PE firms were founded. These strategies are characterised by their unique risk-return profiles and volatility rates. European and US large-cap buyouts, for example, go through peaks and troughs but, overall, they tend to generate stable returns. On the other hand, growth equity, as seen from the graph, is significantly more volatile but also has a higher risk-return profile.
Identifying top-tier managers is the key to success in PE
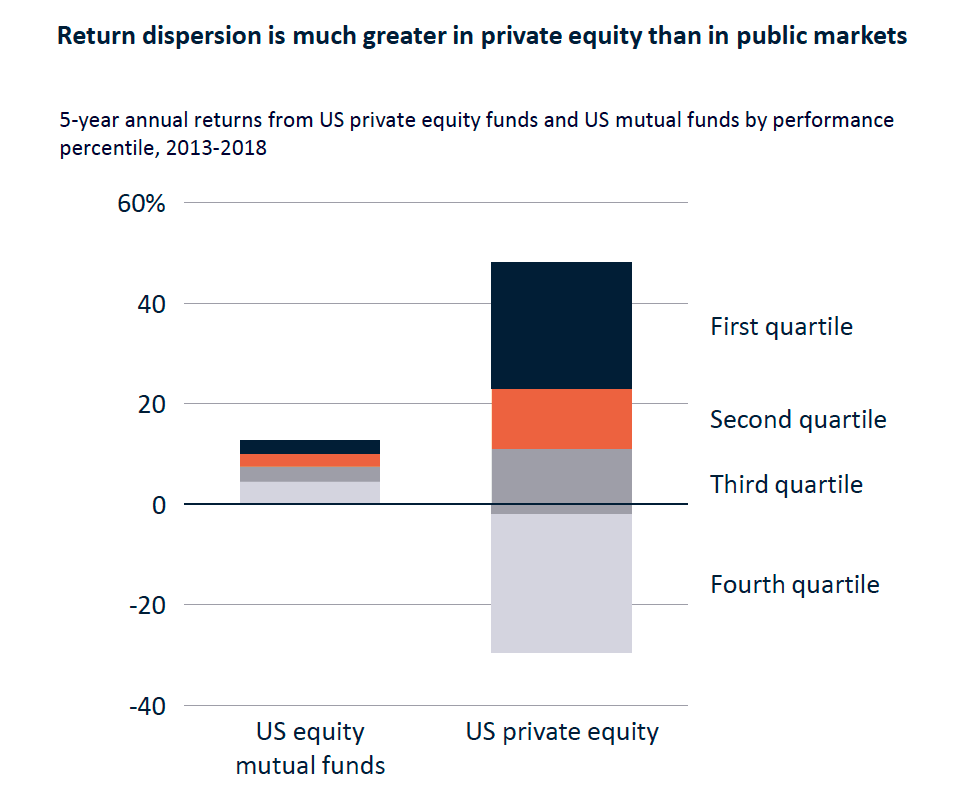
Private equity has a much greater return dispersion than public markets. There is no “index hugging” in private equity and the asset class is inherently illiquid with fewer possibilities for portfolio rebalancing.
Savvy investors who can pick top managers can therefore outperform the median by a wide margin. These best performing managers typically have the expertise across the entire value chain of investments, have the right deal sourcing capabilities, are able to add value through operational improvements and have the shrewdness and market insight to enter or exit the investments at the right time. (Click to see more about Fund manager due diligence.)
Inside the PE fund and the J-Curve
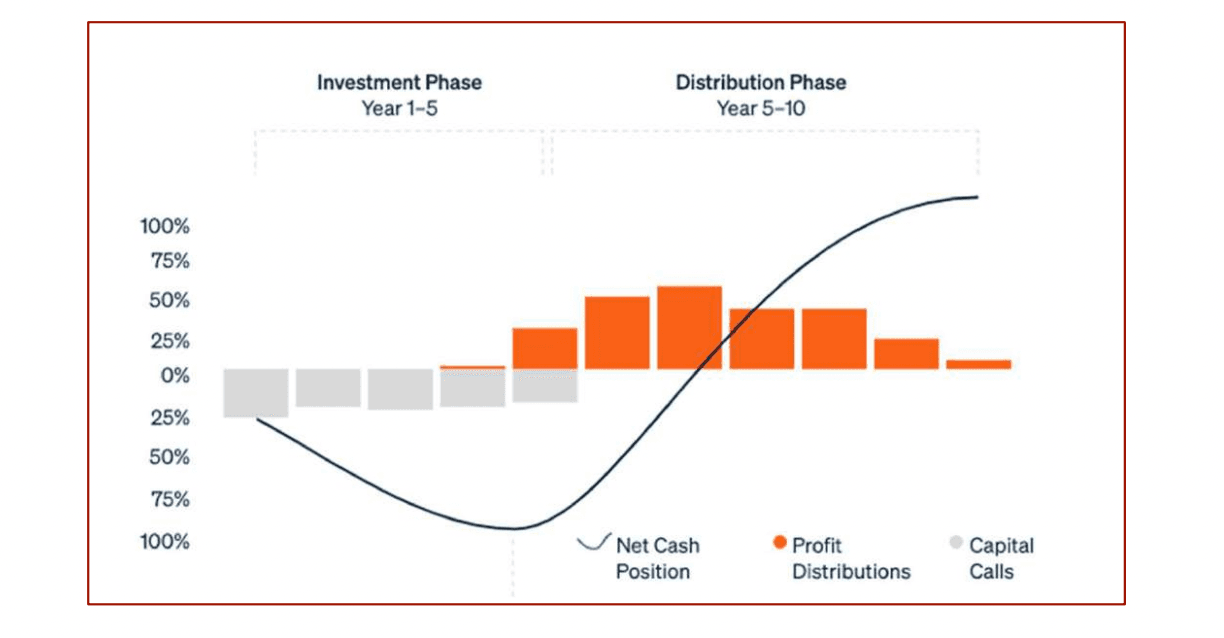
And, finally, the famed J-curve. In PE, funds are typically structured as 10-year vehicles. The fund managers invest in companies for the first five years and distribute returns from exiting these companies in the second half of the lifecycle.
There are 3 ways of investing in PE:
- Firstly, investors can stick to the fund from the start to the very end. We call these investors primary.
- Secondary investors, on the other hand, enter in the middle of the fund’s lifecycle, often between the fourth and sixth year. Secondary investments have their distinct benefits - investors typically invest in a smaller blind pool (meaning that many acquisitions are already known) and can enjoy quicker distributions (but the overall multiple may be lower). In the last few years, secondaries have become an important tool for portfolio diversification - both within private markets and across the private-public spectrum.
- The third way of PE investing is in a form of co-investments which allow individual investors to invest directly in companies together with the fund manager, with a minority share. The appeal of the co-investments are significantly lower fees and carry - the latter is a share of profits that go to the general partners as a type of performance fee.
Disclaimer: Private Equity Index vs S&P 500 index: Past performance is no guarantee of future returns. CA US Private Equity (PE) Index as sourced by Cambridge Associates’ Q4 2020 “Index and Selected Benchmark Statistics” report. The Cambridge Associates Private Equity Index is a pooled horizon IRR calculation based on quarterly data compiled from over 8,300 private equity funds, including fully liquidated partnerships, formed between 1986 and 2020. S&P 500 Total Return Index as sourced from Yahoo Finance. S&P 500 TR Index data are annual compounded return calculations which are time weighted measures and are shown for reference and directional purposes only. The CA PE Index is not an investable index and is used solely for illustrative purposes. The CA PE Index includes only Buyout and Growth Equity funds which matches the investment opportunities currently offered by Moonfare. Due to the fundamental differences between the two calculations, direct comparison of IRRs to time weighted returns is not recommended. The chart shows the net growth of a $100 hypothetical initial investment in the referenced indexes on December 31, 1999. Index data does not include the effect of Moonfare’s feeder fees, that are levied on top of the private equity funds offered and are estimated to decrease their net returns by c. 2.3% on an annual basis. The index is denominated in USD and so the returns that an investor receives may increase or decrease depending on FX changes.


¹ Minimum investment may vary by country and investor category.

