
Key takeaways:
- Industry’s most respected data providers reaffirm private equity's long-term outperformance.
- Comparing broad PE benchmark returns to public indices can be misleading due to differences in methodologies, sector composition and the simple fact there’s no investable index for private equity.
- Returns outperformance is not found in the average, but in the selection of top-tier managers, which we believe is the key to grasping the true potential of this asset class.
The last two to three years have been challenging for private equity. A confluence of elevated interest rates,¹ macroeconomic uncertainty and a more muted exit market² has created a difficult environment for general partners (GPs) and their limited partners (LPs) alike.
However, a deeper look at various metrics shows that private equity continues to deliver superior returns compared to public markets over multi-year horizons (note that previous performance does not ensure similar results going forward).³ ⁴ ⁵
Private equity benchmarks
To properly assess private equity performance, it is important to understand how it is measured. Reliable data providers like Cambridge Associates, MSCI, Preqin and PitchBook are closely monitored sources of industry-wide data, which they build by aggregating the performance of thousands of individual private funds.
These benchmarks are constructed from fund-reported cash flows and net asset values (NAVs) and are almost always calculated net of fees and carried interests. The underlying data sets are vast. For instance, the MSCI database includes over 14,000 funds,⁶ while Cambridge Associates tracks over 9,900.⁷
To compare these illiquid, long-term returns against public markets, analysts typically use a Public Market Equivalent (PME) methodology. A PME calculation shows the return that would have been earned if the same cash flows invested in a private fund had instead been invested in a public market index instead, such as the S&P 500 or MSCI World.
For example, Cambridge Associates’ Modified PME (mPME) replicates private investment performance under public market conditions by purchasing and selling a public index according to the private fund's cash flow schedule. A PME value greater than 1.0, or a positive "value-add" in the case of CA’s mPME analysis, implies outperformance over and above the public market.
Performance breakdown
A review of recent reports from the industry’s data providers seemingly reaffirms private equity's long-term outperformance. Let’s pick through them one by one.
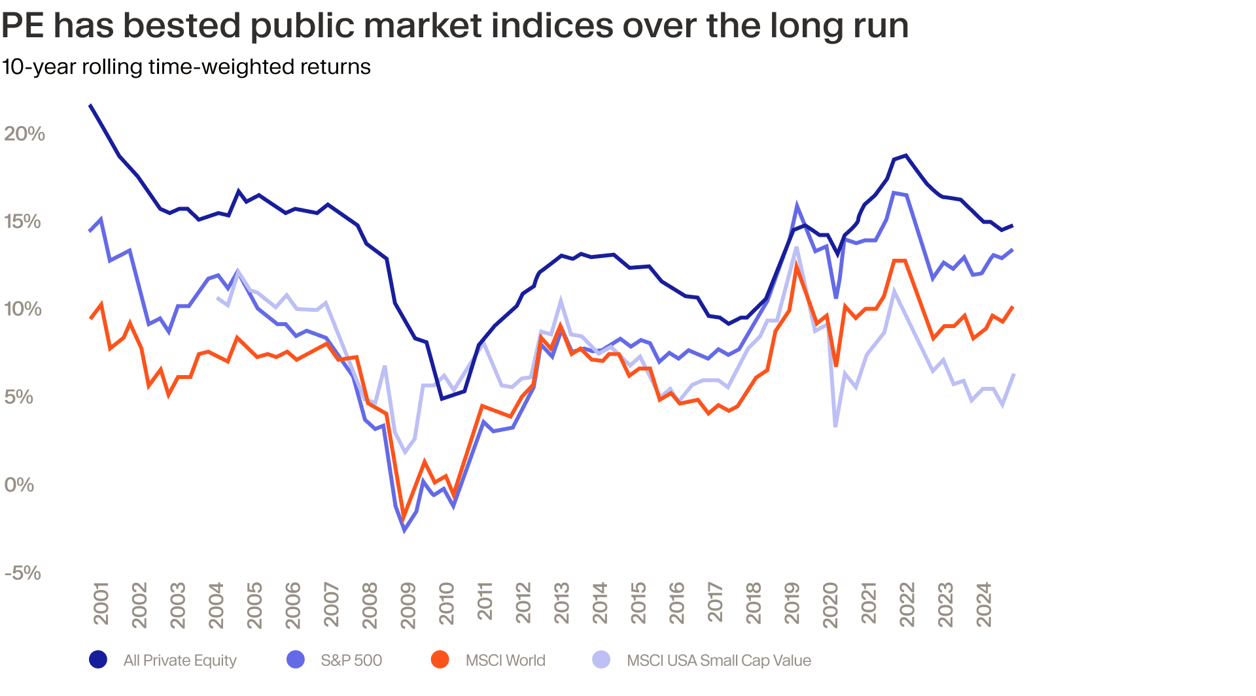
Hamilton Lane: In its 2025 Market Overview, the investment manager estimates that $1 invested in private equity in 2015 would have grown to $3.96 by 2024 — outpacing the S&P 500 at $3.51 and the MSCI World at $2.61. Similarly, rolling 10-year returns, defined as a series of overlapping internal rates of return (IRRs) ending at different points in time, illustrate that private equity outperformed public markets across most periods (see chart).⁸
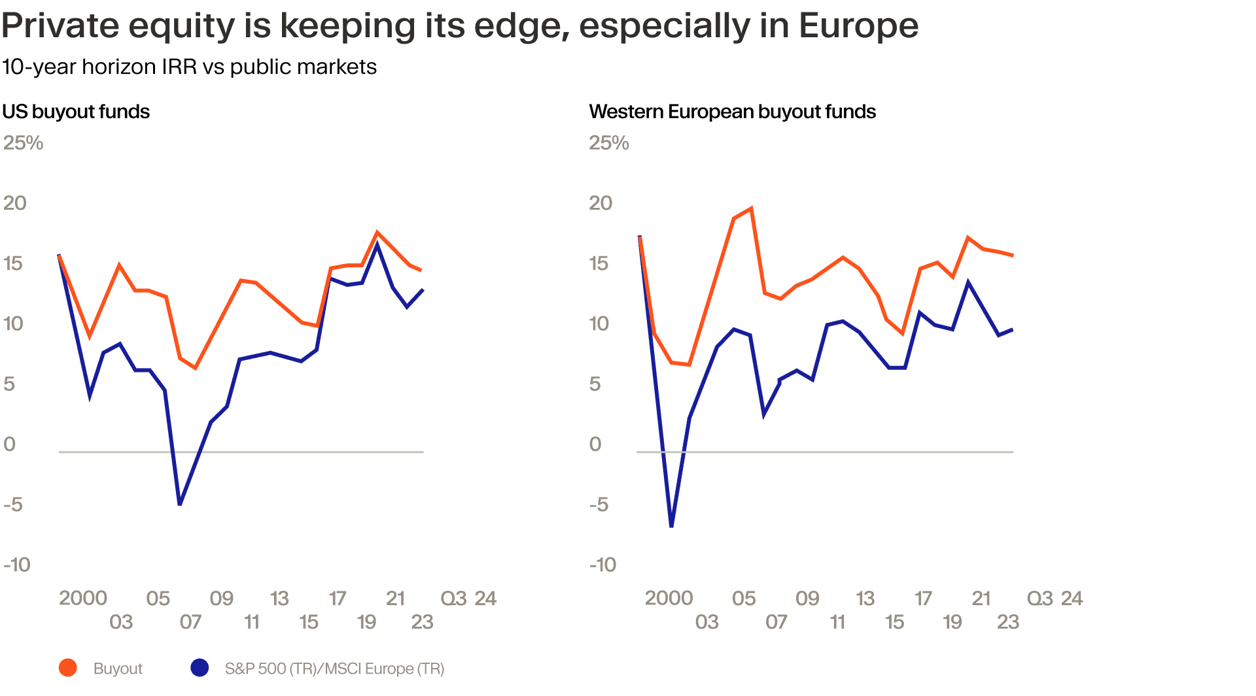
Bain & Company: The consulting firm used MSCI data to calculate the 10-year average horizon IRR for buyouts and compared it to PME benchmarks based on the S&P 500 and MSCI Europe. Their findings — echoing Hamilton Lane’s analysis — show that private equity outperformed public markets across the entire 24-year period, though the extent of outperformance varied by region. In Europe, where public indices are more diversified across industries, the return gap in favor of private equity has been more stable and consistent than in the US.⁹
MSCI: One of the limitations of using the S&P 500 as a benchmark is the sheer size of the companies it tracks — the median market capitalization of the index being a massive $36.4 billion in July 2025.¹⁰ MSCI, a provider of investment decision support tools, overcomes this by also including smaller-caps. Their MSCI AWI IMI index covers 99% of the global equity investment opportunity set. And while private equity lagged the index in 2023-2024, it has massively outperformed in prior years and with significantly shallower drawdown in 2022.¹¹
Cambridge Associates: Similar to MSCI, Cambridge Associates, a data provider for institutional investors whose benchmarks are a bellwether for the industry, uses smaller-cap benchmarks for closer equivalency. Their Q3 2024 data shows the US Private Equity Index returning 15.25% over a 10-year horizon, generating 219 basis points of value-add over the Russell 3000 Index PME and 480 basis points over the MSCI World PME.¹²
(Note that these models are only meant to be indicative and do not constitute advice, and that past performance does not guarantee future results.)
Issues with comparing private and public benchmarks
While PME and other benchmarks are useful for understanding general market dynamics, investors need to be aware of their limitations.
Methodologies differ: Certain indices bundle private equity, venture capital and private debt together. An investor focused purely on buyouts will not find this relevant to their specific portfolio exposure. Blended benchmarks obscure important nuances across asset classes.
Public indices are highly concentrated: The S&P 500’s stellar performance has been driven by a small handful of mega-cap stocks and their aggressive multiple expansion. The 10 largest stocks in the index now account for over a third of its total market cap, a level of concentration that far exceeds the dot-com bubble era.¹³ ¹⁴ We believe this makes the index a less relevant comparison for a diversified private equity portfolio.
Sector exposure is not necessarily the same: Private equity will typically invest more heavily into industries such as healthcare, software, business services, contrasting broader indices that often include consumer discretionary goods and industrials which tend to be more sensitive to economic cycles.¹⁵
You can’t invest in a PE index: The S&P 500 is an investable index. You can buy an ETF and achieve a broad market return. There is no equivalent for private equity. Accessing the asset class typically requires selecting and committing to individual funds, which leads to the most important point: we believe that success depends entirely on selecting the right managers.
The power of top-quartile performance
Private equity is not a market where you buy the average. The dispersion of returns between the best and worst-performing managers is vast and persistent.¹⁶
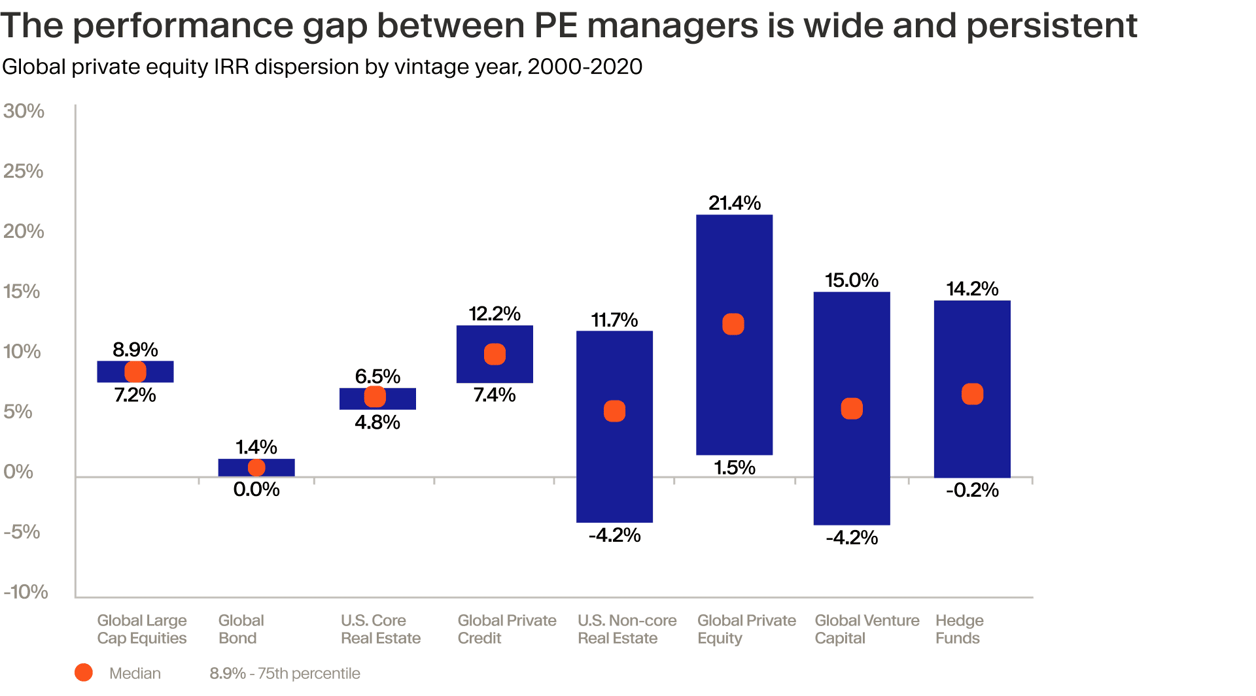
Data from J.P. Morgan Asset Management illustrates this clearly. Looking at global buyout funds from 2000-2020, the gap between top-quartile and bottom-quartile performers is consistently wide, often far exceeding 1,000 basis points.¹⁷
As a result, the outperformance of top-tier managers is striking. According to data from Blackrock’s data provider eFront, upper-quartile private market funds — including private credit and real assets — generated substantially higher returns compared to the median funds. Between 2013 and 2023, this performance gap ranged from 5.2 to 12.8 percentage points, again underscoring the importance of selecting high-performing managers.¹⁸
Further evidence of outperformance at the higher end comes from a 2025 study by the Fisher College of Business, which found that top-quartile funds delivered a 2.15x TVPI (Total Value to Paid-In) and a 22.5% IRR between 2000 and 2020 — exceeding the CRSP PME benchmark by 35%.¹⁹ The CRSP index, which covers nearly the entire US equity market, is widely used in academic and investment research as a public market proxy.
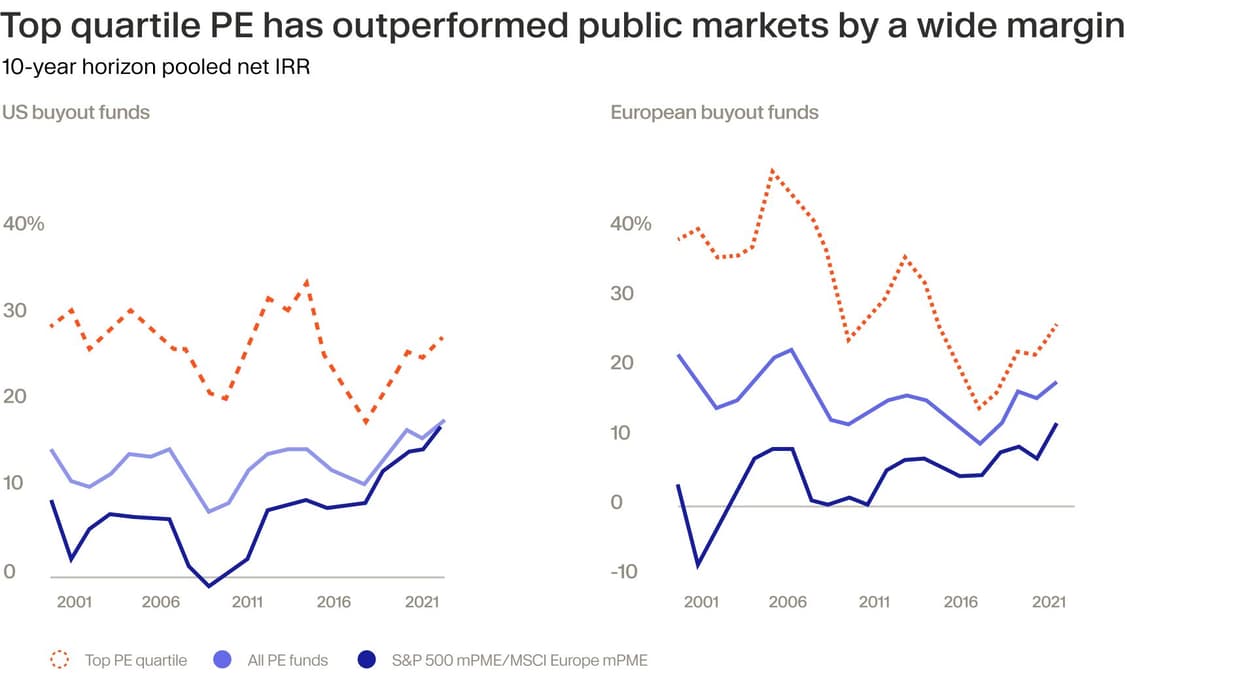
Similar results can be observed in Bain & Company’s analysis of Cambridge Associates data. The report found that top-quartile buyout funds have surpassed public market equivalents in both the US and Europe by a significant margin (see chart below).²⁰
Where does this outperformance of top tier managers come from? In our view, it stems from an operator’s ability to generate alpha through sector expertise, operational improvements and EBITDA growth, a skillset that has become more important as financial engineering has faded as a primary value driver.²¹ ²²
We believe that selecting managers with these capabilities involves looking beyond headline metrics to identify foundational strengths and a demonstrable ability to deliver throughout business cycles.
Moonfare’s approach
Moonfare has sought to build the entire investment framework around this core principle. We apply a highly institutional due diligence process that evaluates GPs across multiple dimensions: not just historical performance metrics like IRR, TVPI and DPI, but also consistency across vintages, team stability, sector focus and a proven track record of value creation.
Ultimately, the goal is to curate access to top-tier managers — often those that are oversubscribed — and to offer everyday investors the ability to build a diversified portfolio across cycles, geographies and strategies, with confidence in the pedigree of each underlying manager. We believe that this is the difference between investing in the market and investing in the best of it.

¹ https://tradingeconomics.com/united-states/interest-rate ² https://files.pitchbook.com/website/files/pdf/Q2_2025_US_PE_Breakdown.pdf ³ https://www.hamiltonlane.com/getmedia/5f672dcb-f2e6-4812-929e-fac717402cee/2025-market-overview_narrative.pdf ⁴ https://www.cambridgeassociates.com/wp-content/uploads/2025/03/2024-Q3-USPE-Benchmark-Book.pdf ⁵ https://www.msci.com/downloads/documents/access/brochures/MSCI-Private-Capital-Benchmarks-Summary-Q4-2024.pdf ⁶ https://www.msci.com/downloads/documents/access/brochures/MSCI-Private-Capital-Benchmarks-Summary-Q4-2024.pdf ⁷ https://www.cambridgeassociates.com/wp-content/uploads/2025/03/2024-Q3-USPE-Benchmark-Book.pdf ⁸ https://www.hamiltonlane.com/getmedia/5f672dcb-f2e6-4812-929e-fac717402cee/2025-market-overview_narrative.pdf ⁹ https://www.bain.com/insights/outlook-is-a-recovery-starting-to-take-shape-global-private-equity-report-2025/ ¹⁰ https://www.spglobal.com/spdji/en/indices/equity/sp-500-equal-weight-index/#data ¹¹ https://www.msci.com/downloads/documents/access/brochures/MSCI-Private-Capital-Benchmarks-Summary-Q4-2024.pdf ¹² https://www.cambridgeassociates.com/wp-content/uploads/2025/03/2024-Q3-USPE-Benchmark-Book.pdf ¹³ https://www.hamiltonlane.com/getmedia/5f672dcb-f2e6-4812-929e-fac717402cee/2025-market-overview_narrative.pdf ¹⁴ https://www.bloomberg.com/news/articles/2025-07-08/scant-winners-in-s-p-500-s-record-setting-march-are-warning-sign ¹⁵ https://www.investopedia.com/terms/c/cyclical_industry.asp ¹⁶ https://am.jpmorgan.com/us/en/asset-management/adv/insights/market-insights/guide-to-alternatives/ ¹⁷ https://am.jpmorgan.com/content/dam/jpm-am-aem/global/en/insights/market-insights/guide-to-alternatives/mi-guide-to-alternatives-us.pdf ¹⁸ https://www.efront.com/en/literature/product-brief/efront-q2-2024-perf-benchmarks-qr.pdf ¹⁹ https://papers.ssrn.com/sol3/papers.cfm?abstract_id=5319498 ²⁰ https://www.bain.com/globalassets/noindex/2022/bain_report_global-private-equity-report-2022.pdf ²¹ https://www.caisgroup.com/articles/evolving-drivers-of-private-equity-value-creation ²² https://www.ey.com/en_lu/insights/strategy-transactions/how-the-drivers-of-private-equity-value-creation-are-changing