
Key takeaways:
- Dealmaking and exits are reopening, giving managers renewed scope to execute strategies and investors greater confidence that capital can be put to work and realised.
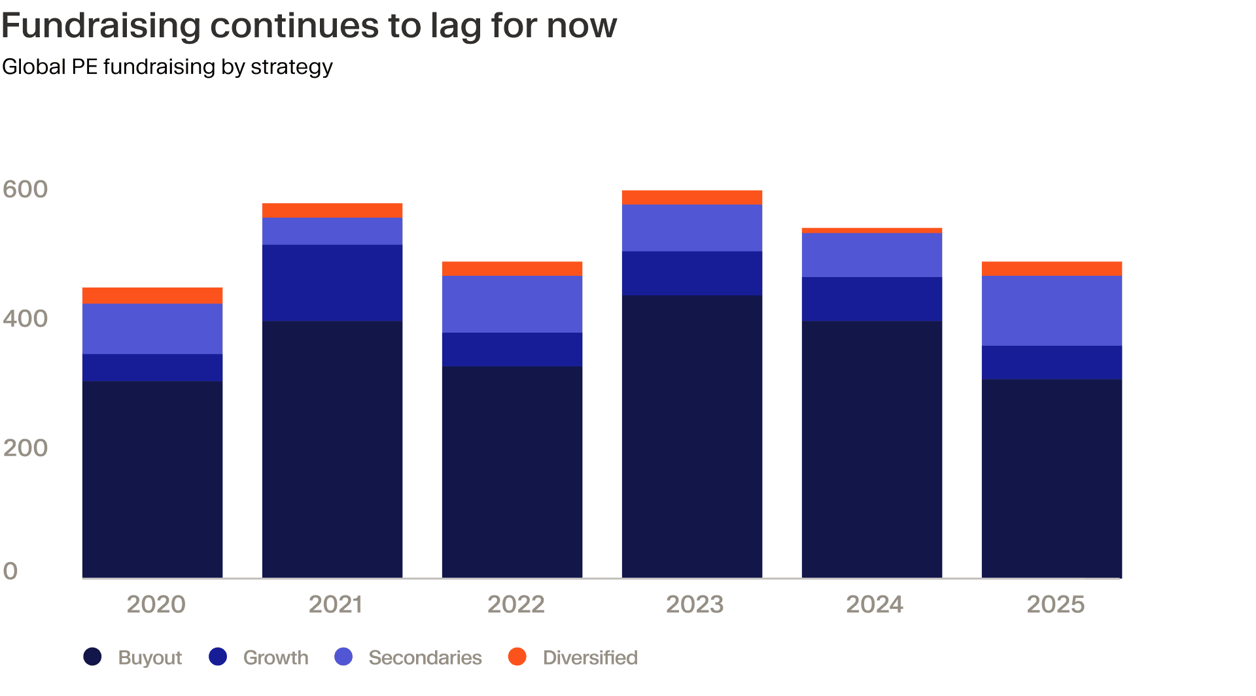
- Fundraising continues to lag, but rising exit value should translate into higher capital flows back into the asset class.
- Emphasis continues to shift towards managers with sector expertise, disciplined underwriting and superior operational execution – characteristics required to deliver differentiated outperformance.
By the end of 2025, global private equity deal value was once again approaching levels last seen before the post-2021 slowdown, while exit value far surpassed full-year totals from each of the prior three years.
For an industry that has spent much of this cycle waiting for the flywheel to restart, activity finally began to turn, signalling a break from the stagnation of the previous two years.
The headline figures
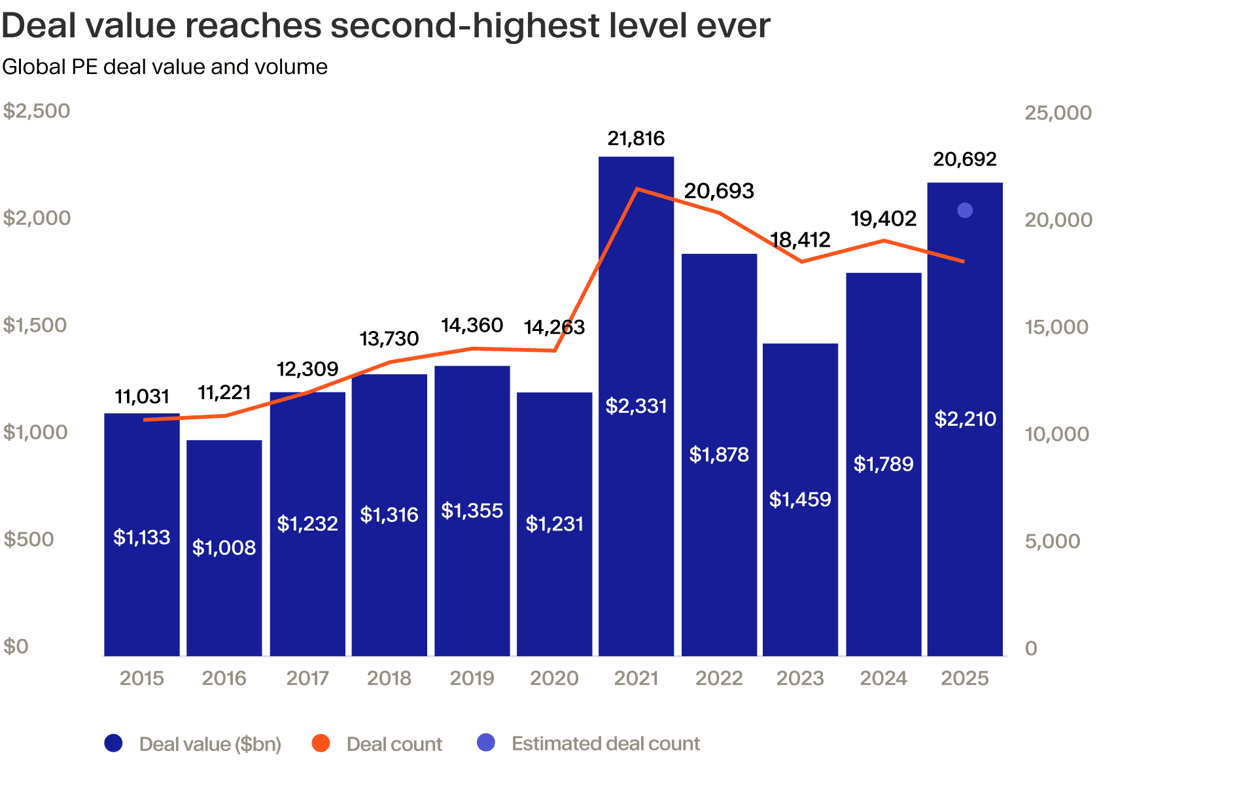
PitchBook data show global private equity moved firmly back into expansion mode last year. Total deal value rose to $2.21 trillion, up from $1.8 trillion in 2024, a 22.9% year-on-year increase and the second-highest level on record. Activity also improved, with total deal count rising by 6.1% (all data are sourced from PitchBook unless otherwise stated).¹
The growth differential between value and volume highlights the character of the recovery. While more deals were completed in 2025, a greater share of them were concentrated in larger transactions, lifting aggregate value more quickly than deal count. This points to improving confidence among sponsors in executing and financing bigger deals, while mid-market has some catching up to do.
Exit conditions improved meaningfully over the course of 2025. PitchBook totals show exit value climbed to $1.35 trillion, up from $896 billion in 2024, an impressive 50.3% year-on-year increase. Volumes also moved higher, with the total exit count rising to 3,977, an increase of 5.6%.
As with fresh deployment, exit value outpaced volume growth, reflecting a market where liquidity increasingly flowed through larger realisations. While not every asset benefitted equally, the rise in both exit value and count signals that liquidity pathways reopened more consistently than in prior years, improving distribution dynamics for investors.
Fundraising, a lagging indicator, was more subdued than investment and exits. Globally, private equity capital raised fell to $407.5 billion, a 33.3% year-on-year decline. The number of funds closed also decreased, to 540 from 1,025, representing a 47.3% contraction. However, as exit activity and distributions continue to improve, fundraising should follow, albeit with a delayed response as investor capital is recycled back into the asset class.
Regional divergence
Regional data highlight a clear divergence in how the recovery played out. Europe remained highly active in terms of deal volume, while the US captured a disproportionate share of dollars — pointing to a widening gap in average deal sizes.
PitchBook totals show European private equity deal count rose to 8,878 in 2025, up 11.3% year on year, reflecting the continued depth of the region’s mid-market. Total deal value increased to €649.5 billion, a 15.2% rise from 2024. While value growth outpaced volumes, average deal sizes remained well below US levels, limiting Europe’s share of global value.
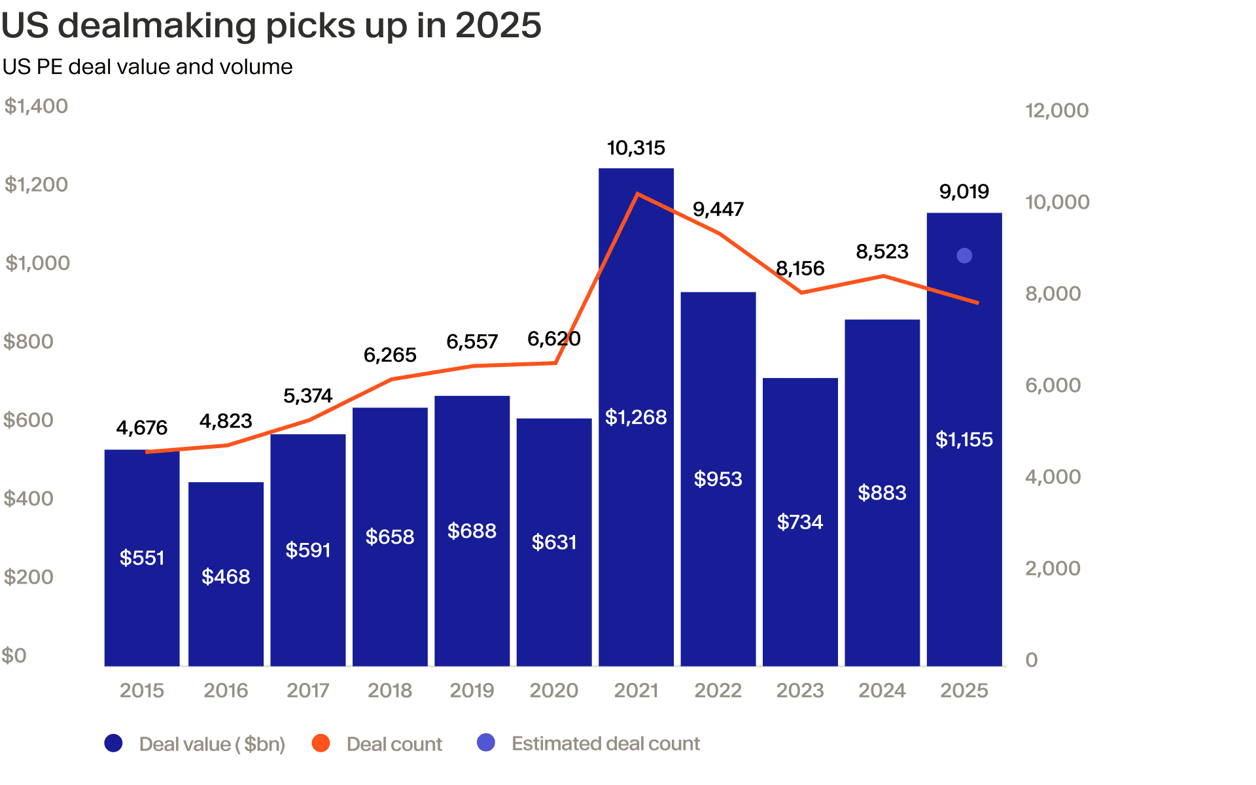
In the US, the rebound was more decisively value-led. Total deal value jumped to $1.16 trillion, up 30.8% year on year, while deal count increased by 5.8% to 9,019. Larger sponsor-led transactions dominated activity, supported by the scale of the US technology ecosystem and the depth of capital available for complex deals.
That contrast is most visible at the top end of the market. The largest US transaction of the year was also the biggest in the PE industry’s history. Silver Lake Partners led a consortium in the $56.6 billion take-private of video game developer Electronic Arts.² In contrast, Carlyle and the Qatar Investment Authority’s €7.7 billion acquisition of BASF’s automotive coatings businesses topped the table in Europe,³ according to Mergermarket data seen by Moonfare.
Fundraising bifurcates
Fundraising didn’t just slow last year — it sorted the field. S&P Global data is moderately more flattering than PitchBook’s, showing that total capital raised was down only 12.7% to $480.3 billion. This was nevertheless the second consecutive annual decline and came with a 7.1% regression in the number of funds launched, which fell to 364.⁴
That backdrop naturally pushed LPs to be more selective about where they concentrated their capital and has favoured larger, established managers with proven track records, while many smaller funds face tougher odds of raising successor vehicles.
Specialists are also securing capital commitments. In a market defined by greater returns dispersion, sector and other niche expertise can deliver repeatedly sharper deal sourcing, cleaner underwriting and more robust exit opportunities – all ingredients that tend to drive alpha when broad beta is harder to come by.⁵ Software-focused firm Thoma Bravo ticked both boxes, raising the largest buyout fund of the year with its Fund XVI capped at $24.3 billion.⁶
Exit concentration
Exit markets reopened further in 2025, but the recovery remained highly concentrated and increasingly US-centric, with a small number of large transactions accounting for a disproportionate share of total value.
US exit value jumped 92% from $383.1 billion in 2024, even as exit count only rose by 17%. Mega-exits were the defining feature, pushing aggregate value sharply higher to a 54.6% global share, as the US asserted its dominance at the top end of the market.
Europe saw a more modest recovery. Total European exit value increased to €299.7 billion, up 9.2% year on year, while exit count rose 7.9%. With value growth marginally outpacing volume, exits also became more concentrated in the region, though to a far lesser extent than in the US.
Secondaries on top
Secondaries continued to cement their position as a structural source of liquidity rather than a niche solution. As holding periods lengthened further, averaging 6.4 years,⁷ and distributions remained uneven, both LPs and GPs increasingly turned to the secondary market to actively manage exposure rather than wait for traditional exits to materialise.
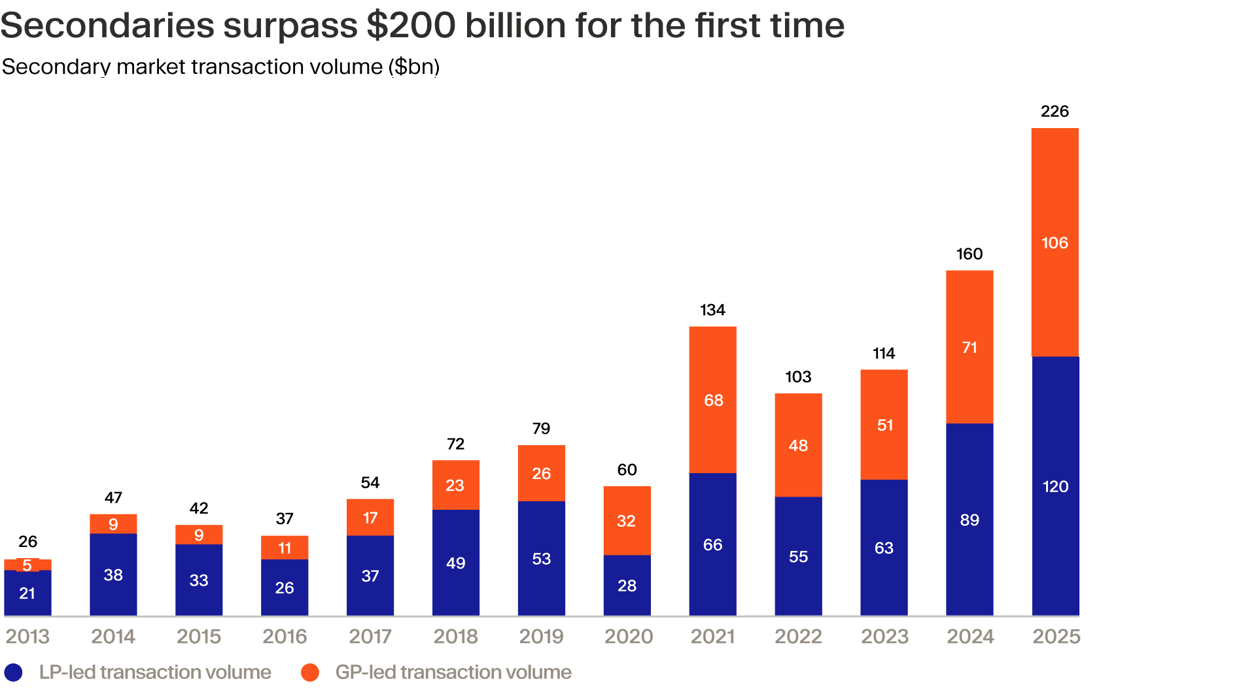
According to Evercore, transaction volumes reached a record $226 billion last year, representing a 41% year-on-year increase.⁸ This was split between $120 billion worth of LP-led deals and $106 billion of deals led by GPs, weighted towards continuation vehicles.
An ageing global portfolio, combined with the sheer scale of unrealised value built up since the 2021 peak, has made secondaries a permanent feature of the liquidity toolkit. For LPs, portfolio sales offered a way to rebalance allocations and free up capital. For GPs, continuation vehicles and structured secondaries provided flexibility, unlocking liquidity for existing investors while preserving upside in high-conviction assets.
Ardian’s record-breaking $30 billion Secondary Fund IX, the largest PE fund closed in 2025 across all strategies,⁹ highlights both the depth of demand for liquidity solutions and LP confidence in experienced secondary managers.
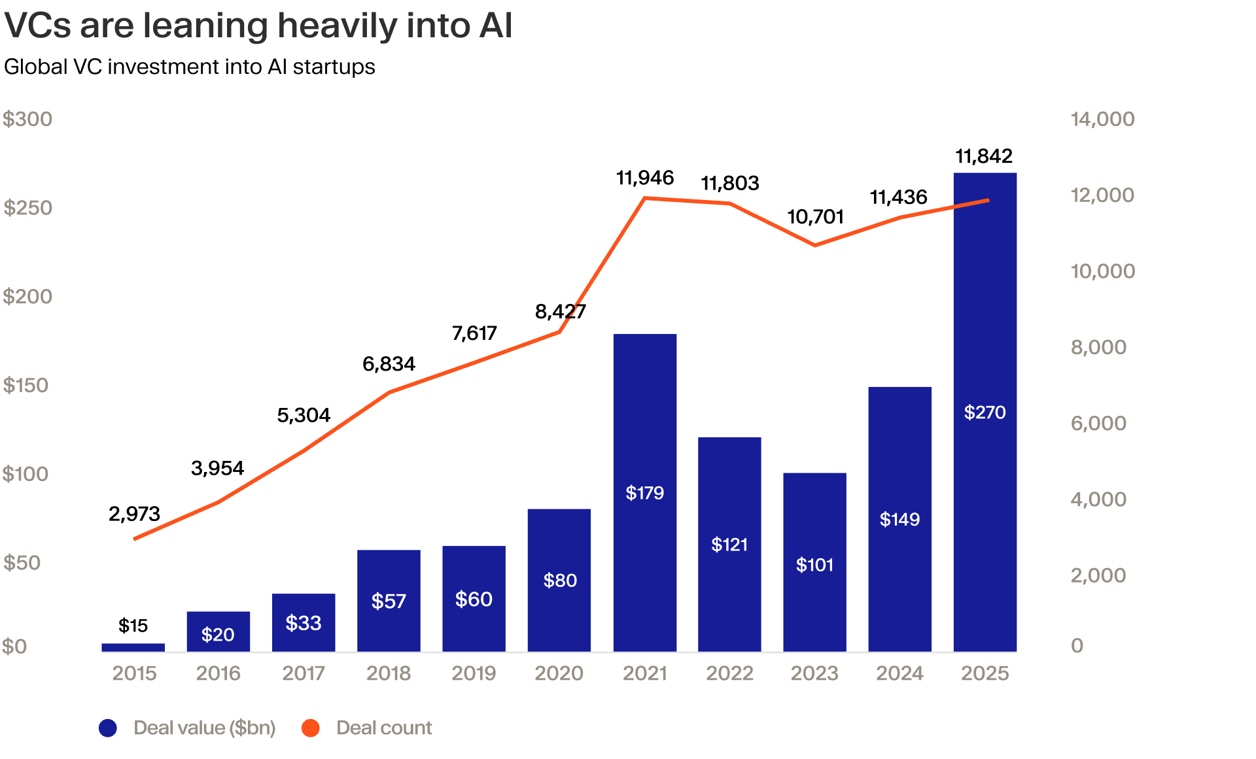
VC leans into AI
Venture capital made an assured comeback, the rebound being conspicuously led by artificial intelligence. Global VC deal value rose to $512.6 billion, up 30.8% year over year, even as deal count edged down by 11.6% to 37,745 individual funding rounds, according to PitchBook data. The North America region accounted for two thirds of this value.
Meanwhile, AI-related deal value surged dramatically and accounted for more than half of all global VC funding dollars. Managers largely seeked to back higher-value, later-stage startups carrying an AI premium in a bid to have a front seat in the current innovation cycle.
OpenAI’s $40 billion fundraise alone was the largest venture round on record, while a handful of other generative AI leaders – including Anthropic, xAI and Scale AI – each secured multi-billion-dollar financings over the course of the year. According to Crunchbase, just five AI companies raised more than $80 billion, accounting for a meaningful share of total global venture funding.¹⁰
Winners and losers
The PE industry has a lot to celebrate on various fronts. Overall, the market last year was healthier but, ultimately, more discerning. The rising tide did not lift all boats.
As outlined in our 2026 Outlook, we believe the industry is entering a new phase where discipline, operational excellence and manager selection will matter more than ever as the bar to success rises higher.
Exits are expected to continue gaining momentum, further helping to unlock distributions; secondaries will remain a structural liquidity valve given the extended holding period trend; and the gap between top performers and the rest of the market will likely continue to widen.
Debt financing costs remain high, blunting the ability to drive value through leverage, and asset valuations are full due to fierce competition for quality companies. This means specialised strategies, deep operational value-creation and thoughtful portfolio construction will be rewarded – the very characteristics central to private equity’s ability to generate differentiated returns in a more selective and demanding market environment.