Private equity asset allocation
Once you have decided that an allocation to private equity could benefit your portfolio and fits within your overall investment strategy, the next question is how much of your portfolio to allocate to private assets. While there are some general guidelines suggested by financial planners and investment consultants, the ultimate allocation decision is a personal one that will depend upon factors such as:
- Portfolio size
- Current portfolio allocation
- Current portfolio risk characteristics
- Liquidity needs
- Income needs
- Time horizon
This article will assist with your allocation decision in three ways:
- Draw context from the experience of institutional investors
- Show how risk-adjusted returns can vary with allocation
- Show how expected returns and volatility vary with allocation
1. Draw context from the experience of institutional investors
Institutional investors, such as pension funds and endowments, have been allocating to private equity for decades. So, while individuals will certainly have their own unique parameters for allocating to private equity, the experience of larger investors and the benefit of their expertise can at least provide a reference point for individuals as they decide how to incorporate new allocations with private equity into their portfolios.
Institutions’ allocations to private market investments have been steadily climbing for at least the last 15 years (as illustrated below) and now exceed 22% on average. When real estate assets are removed from the total allocation, private equity, infrastructure, private credit, and other alternatives averaged about 15% in 2019.
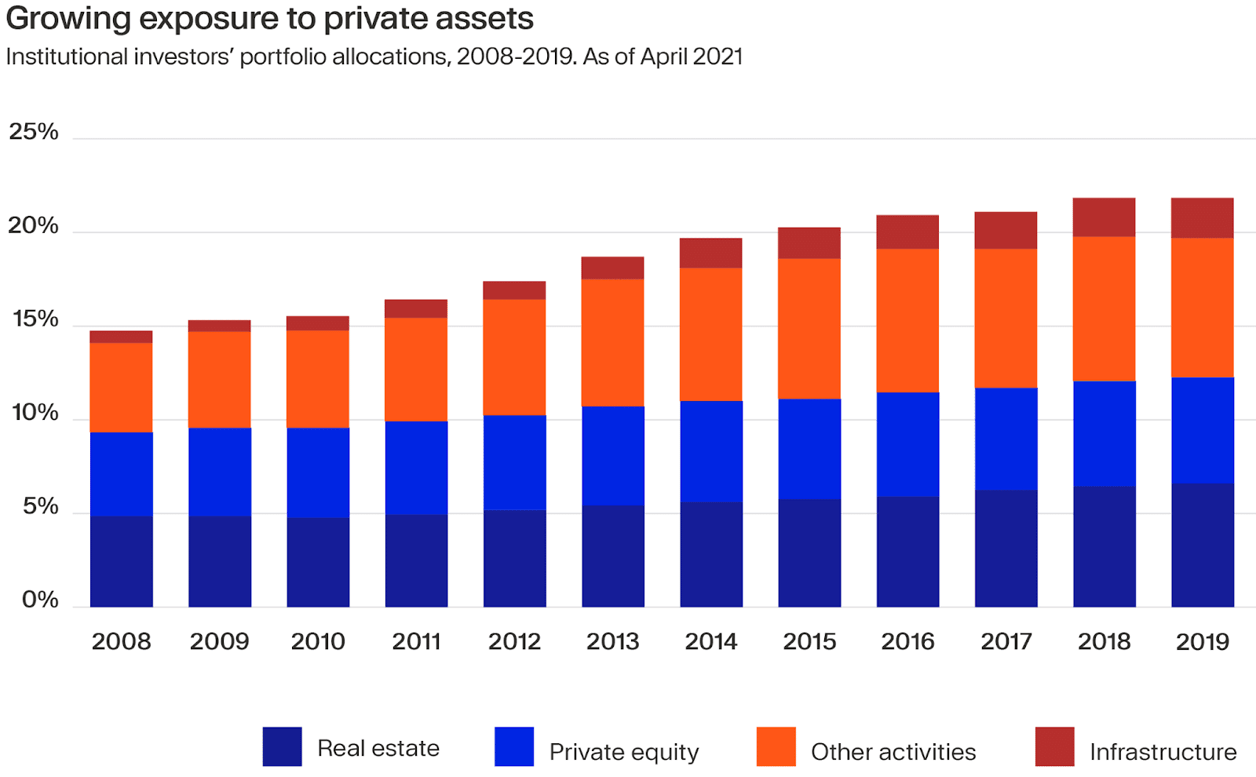
As an average figure across hundreds of institutions, one might expect to see typical allocations to private market instruments at between 5% and 30% of total assets. While institutional investors tend to be somewhat risk-averse overall, they have also had a great deal more experience with private markets and their larger portfolios may afford a more lenient approach to the illiquidity of private investments. As such, their approach toward private market investments should be used as a guideline with those factors taken into consideration.
2. Show how risk-adjusted returns can vary with allocation
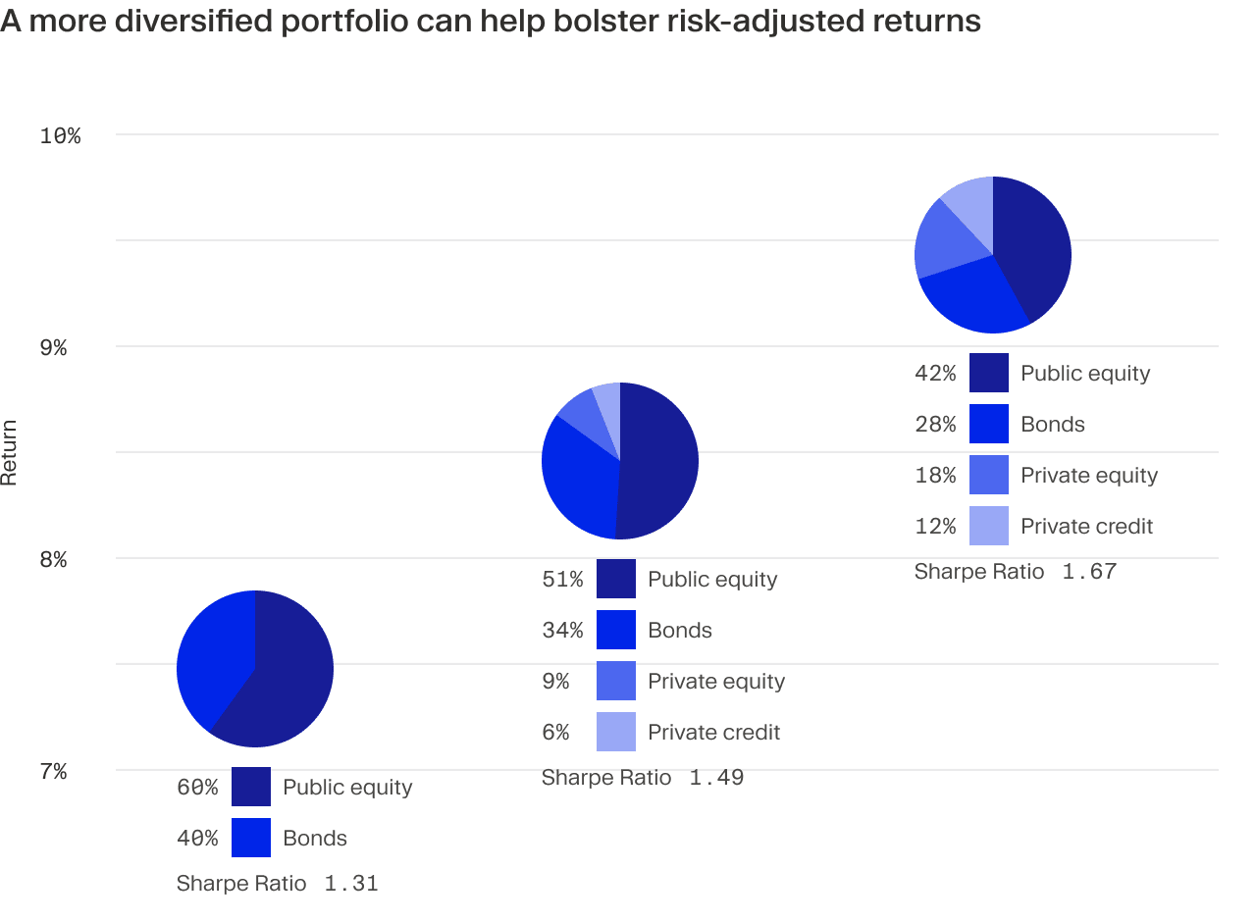
Further context can be obtained by considering the effects of private equity allocations to the overall performance of an existing portfolio.
An example is illustrated below using research from Hamilton Lane. The chart indicates that between the 20-year period 2000 and 2020, a 60/40 portfolio (public equity and bonds) offered annual returns of around 7.5 percent. However, for the same period, a portfolio with a larger allocation to private equity and real estate (42 percent public equity, 28 percent bonds, 18 percent private equity, 12 percent private credit) offered annual returns of 9.40 percent with higher Sharpe ratios.
3. Show how expected returns and volatility vary with allocation
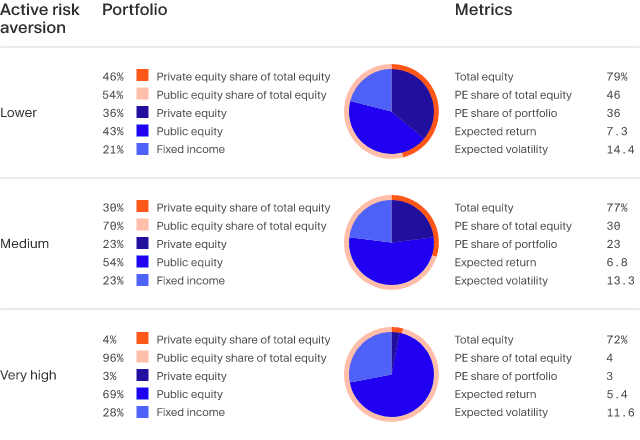
Research from Vanguard that maps out the expected return and risk (volatility) results from different allocations¹ is shown below. This example uses the traditional 70% Equity / 30% Bond portfolio as a starting point and assumes that instant, continuous rebalancing is not possible due to the illiquid nature of private equity.
Allocations to private equity vary considerably, even among institutional investors with many years of experience in the private markets. Investors should carefully consider their strategic objectives and the expected effects of adding PE to their portfolios when determining how much of an allocation is right for them. In addition, they should expect to modify their allocation over time as they become more experienced with private assets and are able to evaluate the impact of such assets on their overall portfolio.
The examples above are meant to provide investors with reference points that can assist them in determining the desired asset allocation of private equity in their portfolios.There is no “correct” allocation profile for everyone, nor is there a “perfect” allocation, since some of the variables involved are subjective (such as liquidity, time horizon, and strategic fit).
The next crucial step in portfolio construction is to choose an investment strategy that aligns with your goals, which we discuss in detail in our article on Private Equity Investment Strategies.

- 1 Minimum investment may vary by country and local regulation.
- 2 Source: McKinsey "Private Markets Annual Review 2022"
- 3 Past performance is no guarantee of future returns.