
Once viewed as a last-resort liquidity bridge, NAV financing has matured into standard-issue capital for managers determined to realise the full potential of their best assets.
Key takeaways
- NAV financing allows private equity managers to borrow against the value of their fund holdings.
- These loans are becoming an increasingly mainstream way of funding follow-on investments and extending funds’ value-creation runway.
- As continuation vehicles grow in popularity due to stretched exit timelines, NAV lending helps managers realise the full potential of portfolio companies without fresh capital calls.
Buyout distributions have slowed down for three years running, LPs have poured more capital into private equity than they've received back, with payouts as a percentage of NAV stuck around 11% – well below the 29% average seen between 2014 and 2017, according to Bain & Company.¹
With $3.8 trillion now tied up in 32,000 unsold companies and average holding periods stretching to seven years, GPs are incentivised to use other means to unlock cash for their investors. The same Bain research shows managers raised $410 billion last year alone through recapitalisations, secondaries and NAV financing loans, demonstrating the rapid innovation in alternative liquidity mechanisms that are now available to managers alongside traditional exit routes.
NAV lending has emerged as an increasingly popular option. Rather than selling prized assets into a sluggish market or accepting haircuts on fund stakes, managers can borrow against their portfolios at par, keeping equity control while freeing up capital for follow-on investments or LP distributions.
In simple terms, Net Asset Value is “a company’s total assets minus its total liabilities”. Learn more at Net asset value (NAV).
What is a NAV loan?
A NAV loan, also referred to as NAV financing, is a private capital solution offered primarily to private equity funds based on the net asset value (NAV) of their investment portfolios.² It provides non-dilutive capital, typically structured as senior debt, that allows fund managers to raise liquidity without sacrificing equity upside.
Unlike subscription lines of credit, which are collateralised by limited partners' uncalled capital commitments, NAV loans are fund-level borrowings secured against the equity value already deployed into portfolio companies. As Oaktree notes, these facilities are typically provided during a fund's value creation phase, when most LP capital has already been called, rather than during the initial investment period.³
What was once a niche tool has rapidly become a standard feature of portfolio management. According to Rede Partners' 2025 market survey, NAV financing has "firmly established" itself as a capital-efficient way to leverage portfolios, with the weighted average volume of deals completed per lender jumping to over €800 million in 2024, up 142% from €330 million in 2023.⁴
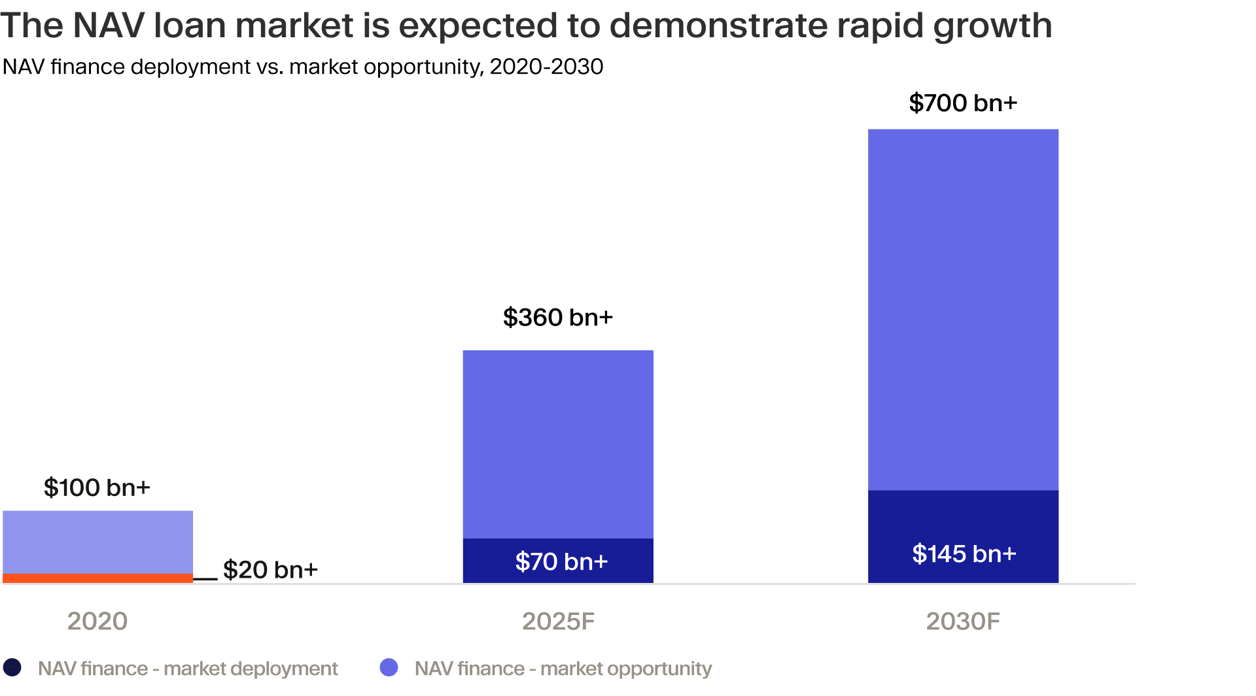
The trajectory points steeper still. 17Capital estimates $70 billion in NAV finance deployment in 2025, with the market potentially reaching $145 billion out of a total addressable market of $700 billion by 2030⁵ as funds beyond their investment period seek ways to tap liquidity.
How NAV lending works
Buyout funds dominate NAV loan borrowing by some distance, representing an estimated 63% of the market, but growth equity, infrastructure, private credit and real estate strategies are increasingly sourcing these facilities.⁶ Lending is also moving down-market, with 60% of lenders reporting increased activity for funds under €500 million in 2025, according to Rede.⁷ Continuation vehicles (CVs) are also active borrowers, accounting for some 40% of lender deal flow.
The collateral consists of a diversified pool of equity interests in the fund's underlying assets, typically structured as share pledges or assignments of cash distribution rights. "Secured" facilities give lenders direct recourse to underlying equity, while "recourse-light" structures offer only cash-flow security with limited enforcement rights – popular for their flexibility despite costing roughly 140 basis points more.⁸
Lenders calculate borrowing capacity using loan-to-value (LTV) ratios typically capped at 5–25% of the portfolio's NAV.⁹ Only "eligible" assets count – those meeting diversification thresholds and concentration limits, where no single asset represents too large a portion. Lenders also require minimum portfolio sizes, often five or more companies, to ensure diversification.¹⁰
NAV lenders sit senior at the fund level, receiving distributions before LPs, but structurally junior to the portfolio companies' own lenders. Repayment comes from asset realisations, with many facilities featuring cash-sweep mechanisms that automatically pay down debt from proceeds. Covenants typically prohibit LP distributions if the facility breaches LTV thresholds or goes into default.¹¹
Why private equity funds use NAV financing
GPs are actively embracing NAV lending for multiple reasons. In its infancy, the market was used by fund managers as a liquidity bridge. Rather than selling assets below their targeted returns or leaving capital locked up indefinitely, NAV facilities provided an alternative option for returning capital to LPs.
The facilities act as a timing bridge. When exit windows are tight, NAV loans provide interim liquidity – whether for portfolio company debt management, working capital, or LP distributions – without crystallising valuations or surrendering upside. As Oaktree notes, this application prevents managers from having to "sell assets at reduced prices during a dislocation" while keeping options open for when markets recover.¹²
Critics have argued that using these loans for early LP distributions is a way to artificially enhance DPI and IRR metrics. Recent data, however, suggest that this gaming of returns is increasingly obsolete. Instead, GPs are now chiefly using NAV loans to fund follow-on investments and add-on acquisitions. Proskauer data show follow-on investments are now the primary use of proceeds, accounting for 45% of facilities¹³, while Rede reports 70% of lenders have seen increased demand for this purpose.¹⁴
LP benefits of NAV loans
Limited partners benefit from NAV lending primarily through the preservation of portfolio value and interim liquidity. By allowing GPs to avoid selling quality assets into weak markets, these facilities protect LP capital from fire-sale discounts while maintaining exposure to the full value-creation arc of winning companies.¹⁵
Rede notes that moderate fund-level leverage helps establish strong early metrics, giving managers confidence to hold performing assets longer and ultimately increase multiples at exit rather than crystallizing lower values prematurely.
The structure also provides downside protection. NAV lenders sit senior at the fund level with typical LTVs capped at 5–25% and covenant headroom that can withstand NAV declines of up to 47.5%, meaning lenders absorb losses before LP equity in stress scenarios.¹⁶
Continuation vehicles (CVs) are a growing use case. GP-led secondaries reached new heights in 2025, hitting a record $115 billion, up 53% year on year, and accounting for 48% of total secondary market volume.¹⁷ CVs drove the majority of this activity, representing approximately 89% of GP-led volume.¹⁸
For LPs rolling into these vehicles, NAV facilities provide the CV with capital for add-on acquisitions and extended hold periods without requiring fresh capital calls from existing investors. Rather than holding static assets during a longer timeline, the CV can actively deploy debt financing to drive further value creation, allowing rolling LPs to maintain exposure to growing companies while the facility funds portfolio company growth.
What are subscription lines of credit?
Subscription lines of credit and NAV facilities both provide liquidity, but they serve fundamentally different purposes across a fund’s lifecycle. Subscription lines, which are secured by LPs’ uncalled capital commitments, act as a bridge during the investment period, allowing managers to deploy capital immediately without frequent capital calls. This is now a $1 trillion market¹⁹ dominated by banks offering standardised, short-term revolving credit.
NAV facilities, however, come into play once that uncalled capital has been exhausted. Rather than borrowing against promises to pay, GPs pledge the equity value of portfolio companies already acquired, using the fund's unrealised investments as collateral to access additional capital. This shift from uncalled commitments to deployed assets is the critical distinction: subscription lines finance the building of a portfolio, while NAV loans fund further value creation and extend hold periods for assets already owned.
Looking ahead
The NAV lending market has crossed the threshold from innovation to established market infrastructure. As ILPA guidelines harden into market convention²⁰ and lender competition compresses spreads, the question is no longer whether NAV facilities will see increasing adoption, but the extent to which managers will structure them responsibly.
With more than $5.5 trillion in fund AUM projected to sit beyond traditional investment periods by 2030²¹, these facilities are becoming the default mechanism for bridging the widening gap between exit timelines and LP liquidity expectations.
Looking ahead, the convergence of NAV finance with the booming CV market suggests fund-level leverage is becoming a permanent feature of capital structures. The managers that thrive will treat these facilities as strategic capital governed by the transparency standards and risk controls that the market’s rapid maturation now demands.

¹ https://www.bain.com/insights/outlook-gaining-traction-global-private-equity-report-2026/
² https://www.oaktreecapital.com/docs/default-source/default-document-library/nav-finance-101.pdf
³ https://www.oaktreecapital.com/docs/default-source/default-document-library/nav-finance-101.pdf
⁴ https://static1.squarespace.com/static/64490f0ae7870656fbebb50f/t/68552451bc6ba91bceedc708/1750410323351/Rede+NAV+report+2025_FINAL.pdf
⁵ https://www.oaktreecapital.com/docs/default-source/default-document-library/nav-finance-101.pdf
⁶ https://prfirmpwwwcdn0001.azureedge.net/azstgacctpwwwct0001/uploads/dfc25d7b37f44a6834505150bab3fa84.pdf
⁷ https://static1.squarespace.com/static/64490f0ae7870656fbebb50f/t/68552451bc6ba91bceedc708/1750410323351/Rede+NAV+report+2025_FINAL.pdf
⁸ https://static1.squarespace.com/static/64490f0ae7870656fbebb50f/t/68552451bc6ba91bceedc708/1750410323351/Rede+NAV+report+2025_FINAL.pdf
⁹ https://www.oaktreecapital.com/docs/default-source/default-document-library/nav-finance-101.pdf
¹⁰ https://www.oaktreecapital.com/docs/default-source/default-document-library/nav-finance-101.pdf
¹¹ https://www.oaktreecapital.com/docs/default-source/default-document-library/nav-finance-101.pdf
¹² https://www.oaktreecapital.com/docs/default-source/default-document-library/nav-finance-101.pdf
¹³ https://prfirmpwwwcdn0001.azureedge.net/azstgacctpwwwct0001/uploads/dfc25d7b37f44a6834505150bab3fa84.pdf
¹⁴ https://static1.squarespace.com/static/64490f0ae7870656fbebb50f/t/68552451bc6ba91bceedc708/1750410323351/Rede+NAV+report+2025_FINAL.pdf
¹⁵ https://www.oaktreecapital.com/docs/default-source/default-document-library/nav-finance-101.pdf
¹⁶ https://www.oaktreecapital.com/docs/default-source/default-document-library/nav-finance-101.pdf
¹⁷ https://www.jefferies.com/insights/the-big-picture/2025-global-secondary-market-review-another-record-breaking-year/
¹⁸ https://caia.org/blog/2026/02/11/continuation-vehicle-boom-structural-shift-or-liquidity-patch
¹⁹ https://www.spglobal.com/market-intelligence/en/news-insights/research/2025/08/the-evolving-landscape-of-subscription-lines-rethinking-risks
²⁰ https://static1.squarespace.com/static/64490f0ae7870656fbebb50f/t/68552451bc6ba91bceedc708/1750410323351/Rede+NAV+report+2025_FINAL.pdf
²¹ https://www.oaktreecapital.com/docs/default-source/default-document-library/nav-finance-101.pdf