
The US stock market is ending the year with volatility at historically calm levels.¹ Credit spreads are at lows and stock market valuations at historic highs.² In that context, it is possible that public markets may see a spike in volatility as we move into 2026. Notably, with the AI boom passing from the MAG 7/Large Language Model phase to one that is more focused and applied, the large tech firm valuations look vulnerable if earnings do not keep rising.
The financialisation of equity markets
The notion of market volatility has changed somewhat since academics studied market seasonality. In particular, equity markets have become more intensely financialised — for example, on many trading days one-day options account for close to 80% of option market volume, according to the Nasdaq exchange. In addition, there are now more ETFs (exchange traded funds) than stocks in the US.³ Add to that record levels of market concentration (the top ten companies in the US account for 40% of SPX market cap, according to Apollo⁴).
To that extent, the financialisation of markets introduces a new form of volatility to equity markets that can magnify upward moves, especially in single stocks, and very likely also downward moves. This effect also leads to a lower correlation between, say, private equity and stocks.
Private markets have historically shown lower volatility in certain periods
This degree of systematic volatility is not present in private markets — though they carry its own risks, particularly capital loss and illiquidity. In this respect, holding private assets in a portfolio may help to diminish the risks associated with market volatility.
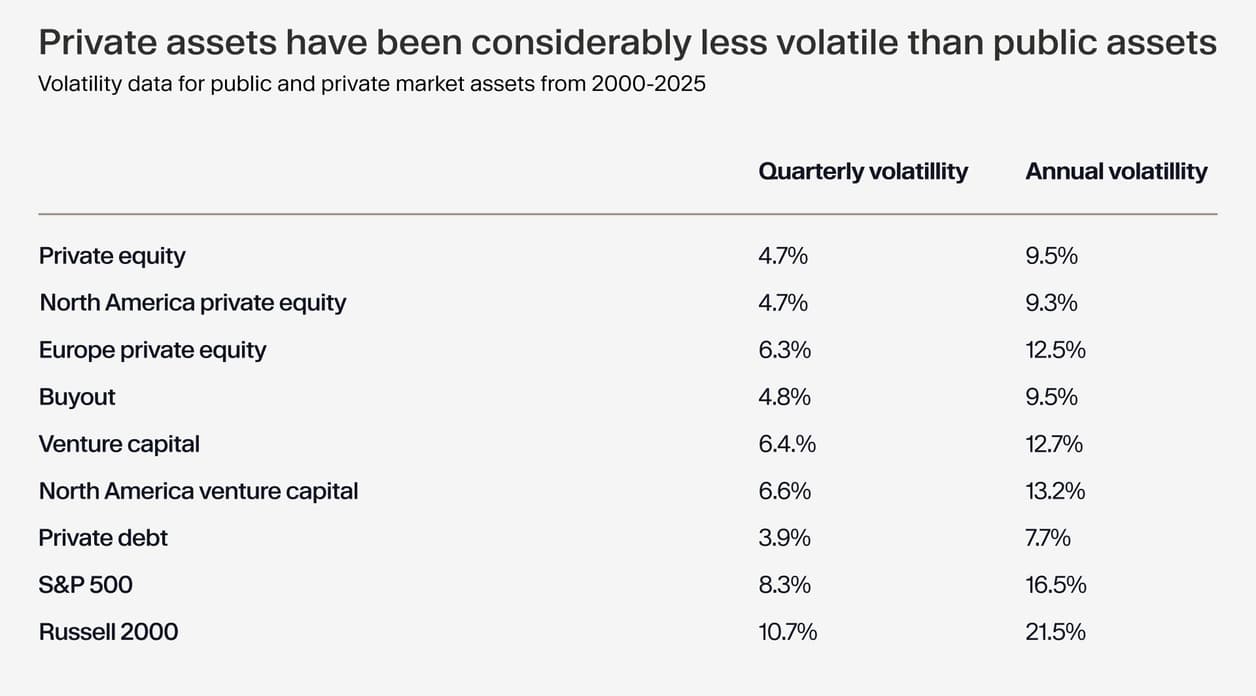
To illustrate this, we have analysed the volatility of the major equity indices – the S&P 500 and the Russell 2000 — as well as that of the major private asset classes (private equity, venture, fund of funds and private debt) using data back to 2000 from the PitchBook Private Capital Indices.
From 2000 to 2025 the annualised volatility of the S&P 500 and the Russell 2000 was 16.5% and 21.4% respectively. In contrast, annualised volatility for the PitchBook Private Equity Index and the Private Debt Index was 9.5% and 7.7% respectively. See the table below for data on selected asset classes.
Adding PE may increase portfolio risk-return profile
As a result, the inclusion of private equity assets in standard portfolios may help to improve the risk-reward relationship. To illustrate, a typical 60/40 portfolio made up of US equities and bonds has a risk/return trade-off, or Sharpe ratio, of 0.78 (higher Sharpe ratio means more return per unit of risk).
Reconfiguring such a portfolio with 20% private equity has boosted the risk-return ratio to 0.94. This has risen to 1.18 when we've computed the risk/return ratio for a typical European family office, where the allocation to private equity is higher at 36%. Reported values are return-to-volatility ratios, calculated as the mean annual return divided by the corresponding annualised volatility. It should also again be noted that past performance is not a guide to future results.
An examination of the behaviour of public and private asset markets over time shows that during the global financial crisis stock market volatility was twice that of private markets, and even more so during the dot-com crisis. In general, private market volatility is more sensitive to macroeconomic risks. Private equity volatility tends to be higher in a recession-type environment, as opposed to general market sell-offs.
With public market valuations at historic highs and markets susceptible to a spike in volatility, we believe that the case for including private equity in a portfolio becomes more compelling.

¹ https://www.investing.com/indices/volatility-s-p-500 ² https://www.spglobal.com/spdji/en/indices/equity/sp-500/#overview ³ https://www.bloomberg.com/news/articles/2025-08-25/us-etfs-eclipse-total-number-of-stocks-in-paradox-of-choice-for-investors ⁴ https://www.apolloacademy.com/extreme-concentration-in-the-sp-500-2/